Skills and tools used for this project:
- Google Forms for creating the diary entries
- Affinity board for collaboratively analyzing qualitative data
- Spreadsheets for analyzing and graphing quantitative data
Why a diary study?
A diary study is a cultural probe conducted with the hopes of gaining insight into the participants' environments to identify issues and possible solutions. Unlike interviews, a diary study can give details about "in the moment" experiences, and help researchers better understand experiences through the users' eyes.Overview
In an effort to better understand people's audio listening experiences, a team of seven students with Humber College's User Experience program ran a diary study. We started out with the goal of identifying potential pain points and possible areas of opportunity with respect to users' audio listening experiences. The team planned and ran the study, and then analyzed the data to ascertain the insights the study revealed.The Research Question
With an increasing amount of competition in the music streaming arena, understanding where user experience can be improved can be a competitive advantage for companies. In an effort to better understand how to improved user experience my team set out to understand the behaviours and emotions of people when they're listening to audio entertainment.As a team, we conferred on what research question we wanted to be able to answer with this diary study. After discussing different possibilities we decided on:
What are the pains and gains of people's audio listening experience?
Before coming up with this question though, we went through a process where first we identified some major themes we were looking to including type of media, concurrent activities (while listening to audio), emotions associated with audio, and motivation. Some of the other possible research questions we thought of under these themes were:
- What kind of audio are users most likely to listen to?
- What kind of devices are they using to listen to audio?
- When are people choosing to listening to audio?
- What kind of activities do people associate with different types of audio?
- What time of day are people listening to audio, and for how long?
- What kind of emotional response do people have to different types of audio?
- Do people listen to audio when they already feel a certain way?
- Why do people listen to audio?
Overview of process
Research Plan
Our group started by preparing a research plan that included the scenario background from above and the research question. We developed a prompt for a participants so they would know when to fill out their diary—submit an entry every time you listen to audio for the primary purpose of listening.
Our hope was to get our seven participants, over the course of three days, to make three diary entries a day. This would give us a target of 63 total entries (we wound up with 62, so close!).
The timeline we developed gave us three days to run the study itself, from Nov.10–Nov.13.
The planning document also contained the text for the email each participant would be sent on the first day with instructions about when and where to fill out a diary entry.
In the instruction email we:
- gave the participants an URL with the Google Form we were asking them to fill out. We suggested they bookmark or save the link somewhere it could be easily retrieved.
- asked them to fill out the diary 3–5 times daily.
- gave them a two letter code name to enter every time they made a diary entry so we knew which participant the data was attached to, without them using their real names.
- advised them we'd be emailing daily to remind them to do the studies.
- provided an email address so they could contact the study if their were any questions or issues.
During this phase we also developed the questions that would be used on the form participants were asked to fill out. We wanted a couple open-ended questions and several multiple choices questions:
- What were you doing while listening to audio? (choose all that apply)
- Possible answers: Driving/commuting, At home, With friends/family, Exercise and outdoor activities, In-person live concert, Other…
- What medium/device(s) did you use to listen to audio? (choose all that apply)
- Phone, Laptop/computer, Home audio system, Personal assistant, Car stereo, Radio, Physical media (eg vinyl records), Other…
- What platform(s) did you use to listen to audio? (choose all that apply)
- Spotify, Apple Music, YouTube, iTunes Podcast, Other…
- What did you listen to? (choose all that apply)
- Podcast/Lecture, Music, Audio Book, Radio Show, Other…
- Please specify what exactly you listened to (Beyonce Playlist, audio book Margret Atwood's Handmaid's Tale, etc.) (open ended question)
- How would you rate this listening experience?
A five point Likert scale ranging from terrible to excellent - Why did you rate it this way? (open ended question)
All these questions were put into a Google Form, and the link shared with the participants.
Running the Study

The study itself began on the the morning of Saturday November 10, 2018. Each one of the researchers on the team had one participant they were required to contact and monitor. We began by sending the email written during the planning to phase to each participant first thing in the morning. The two following mornings, we sent reminders to the participants. Each group member was required to monitor their participant's responses, and prompt them if they weren't submitting enough (minimum 3), to make sure they were recording their experiences.
We ran the study for three days, and at the end had 62 diary study entries. That gave us about 434 separate data points to consider when analyzing the data!
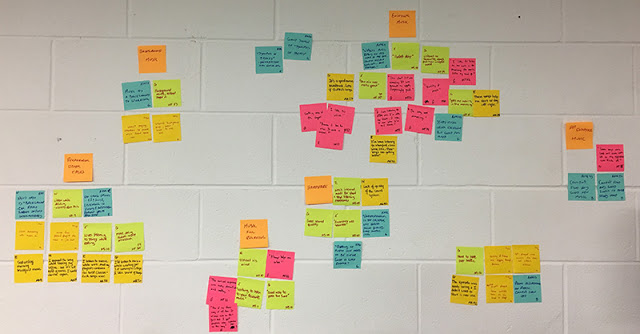
Analysis
We started our analysis by taking the answers from the open ended questions and creating an affinity board as a group. We developed a number of clusters of similar data that started to lend themselves to some broader themes.
We also looked at some of the quantitative data which also revealed some insights into audio experiences.
- Most listening sessions are music, 77.4% of them
- In a distant second, people were listening to podcasts or lectures 9.7% of the time, meaning all the other listening experiences (six separate experiences) made up 12.9% of experiences
Themes identified during analysis
After running through the synthesis exercises, the group came together and identified these themes that helped us answer the research questions:
1) Negative experiences are often due to extrinsic issues, eg:
When participants reported a bad or terrible listening experience, we found that it was regularly due to some reason they couldn't control. One participant rated their listening experience as bad, but not because they didn't like the song, but because the one song was stuck on repeat and they were unable to change it because their hands were dirty from cooking. Another participant complained about a weak wi-fi connection causing interruptions while listening.
"I really liked the song. However I had accidentally left my phone on repeat. And since I was cooking food, and had unclean hands. I had no choice but to listen to the song over and over and over again." —Participant SW
"My Internet connection was weak. So, the music would stop and start loading a couple of times and I wasn't able to listen to the music in a seamless way!" —Participant MS

2) People listen to music while doing other things
51% percent of participants' music listening experiences were while they were at home cooking, cleaning, or showering and 24% were while they were driving or commuting. The data demonstrates that people most often listen to music while simultaneously performing other tasks. Quotes such as the one below helped reveal why users listen to music in this way.
"Music makes my experience doing chores a lot more pleasant." —Participant NF
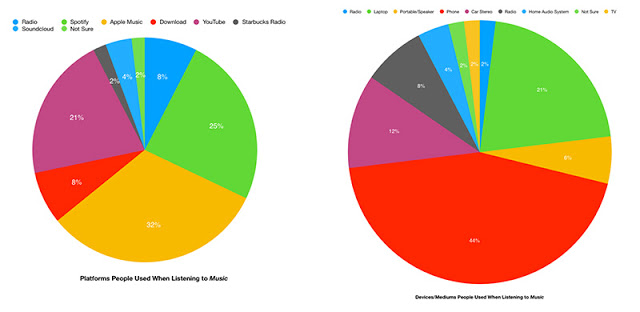
3) People prefer to use phones and laptops while listening to music, and that the dominant way of listening was with streaming services
The study showed that 44% of participants' music listening experiences were through a phone and 21% were through a laptop. It is safe to say that internet connected devices are most users primary way of accessing and listening to music. 32% of participants music listening experiences were through Apple Music and 25% through Spotify. Taken with some of the other findings, it suggests that these services meet the other needs people find important: sound quality and listening while doing other things such as commuting.
4) Listeners are cognizant of sound quality and its impact on the listening experience
We found that the participants understood the impact that the quality of the audio could have on their listening experience. One participant reported a great experience noting that “the voice was clear and audible.” Another participant reported when listening to news radio on an AM station (a medium with notoriously low quality sound), the quality was good enough for the type of audio.
"The experience was great. The voice was clear and audible and the experience was seamless." —Participant MS
5) Mood affects listening choice and vice-versa
We noticed that listeners often reported that when listening to music, their mood was an important factor. This worked both ways: they tried to find music that fit their mood, but often the music they were listening to affected their mood.
"I like to listen [to Dua Lipa] in the morning. Her music, lifts my mood up." —Participant MF
"Upbeat music really fit my mood at the time. I found myself singing and sometimes even dancing around." —Participant SW
6) There was a lot of variation in the type of music that people used playlists for
People used personal playlists and pre-made lists from the streaming services. There was no consistent type of music that proved popular, indicating that variation was important to listeners. Some playlists were collections of individual artists, others were compilations such as Apple Music's "Acoustic Chill" playlist.
Reflections
The study revealed some interesting themes that an audio streaming service would want to consider as they go forward. Streaming is definitely a popular space, and it's become the dominant way to listen to audio, regardless of where the user is. What's also interesting is how much people use the desktop computing experience—mobile phones aren't the only way people use streaming services. A streaming company would want to make sure as they're planning further UX research and design they want to consider both interfaces. Also they want to make sure sound quality, and the ability to match music choices to mood meet the users' needs.
As far as running the study goes, one thing the group realized was that 2/3 of the study was run over the weekend. It's likely this could have skewed the data, especially with regards to what locations people listening in. During the week, participants would possibly have been more likely to be listening while commuting. A longer time period that covered an even match of weekdays and weekends would have been better.
Photo of headphones at top of page by Aaron Yoo, 2018 licensed under CC BY-ND 2.0